How to Write Clear Project Status Reports
How to Write Clear Project Status Reports
Want to write project status reports that are clear, concise, and actionable? Here's how you can do it:
- Start with your audience: Tailor the details based on who will read the report - executives, technical teams, support staff, or customers.
- Use a consistent format: Include key sections like project health, progress, risks, timeline, and next steps.
- Focus on outcomes: Highlight results and their impact instead of listing every task.
- Be transparent: Share risks and blockers early to maintain trust.
- Leverage visuals: Use simple charts or tables to summarize data clearly.
A great status report keeps everyone informed, reduces unnecessary back-and-forth, and enables timely decision-making. Stick to a structured approach, and you'll ensure your updates are both effective and easy to understand.
Write Better Project Status Reports
sbb-itb-66f4c95
Know Your Audience and Goals
Project Status Report Audience Guide: Content Focus and Ideal Length by Stakeholder Type
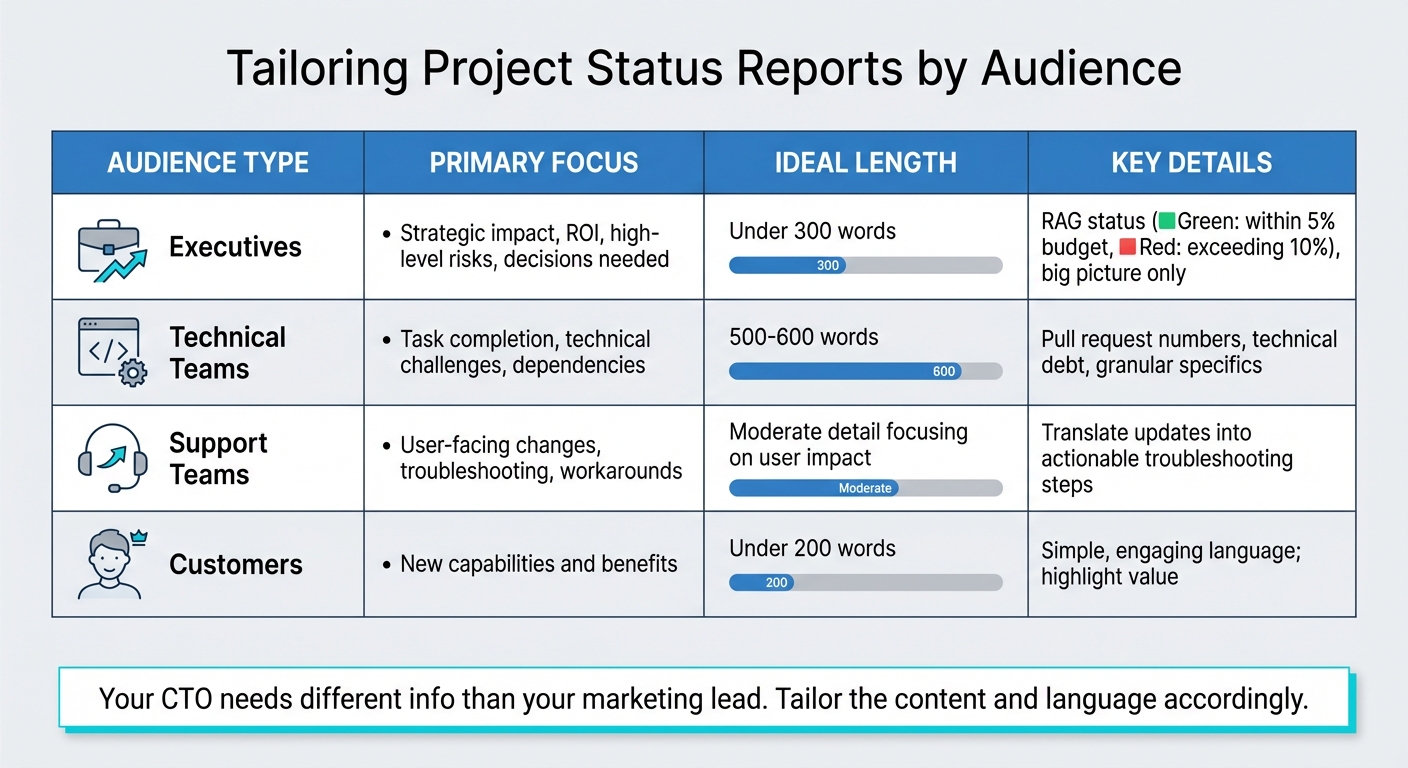
Before diving into writing, take a moment to identify who will be reading your report and what they need from it. Rajni Rethesh from MiddlewareHQ emphasizes this perfectly:
"Your CTO needs different info than your marketing lead. Tailor the content and language accordingly."
Your audience influences everything - how long the report should be, how much technical detail to include, and even the style of communication. For instance, executive summaries should be concise, ideally under 300 words, as brevity increases the likelihood they'll get read. On the other hand, technical teams may need more detail (around 500–600 words) to fully grasp the intricacies of a project. For customer updates, keep it even shorter - under 200 words - since long-winded announcements tend to lose their attention.
Define What Your Report Should Accomplish
Be clear about the purpose of your report. Is it a routine update? Are you escalating an issue, requesting a decision, or celebrating a milestone? Each goal calls for a tailored tone and structure.
If you're highlighting problems or seeking feedback, make that clear at the start. This ensures your readers know what action you’re expecting from them. Reports that fail to address key points often lead to follow-up questions, while overly detailed ones risk being ignored altogether. Striking the right balance ensures your report is useful and actionable.
When done right, a report doesn't just inform - it empowers stakeholders to make timely, effective decisions. This builds trust and strengthens communication.
Adjust Tone and Content for Your Readers
Tailor your tone and level of detail based on your audience's familiarity with the project. Here’s how you can approach different groups:
- Executives: Stick to strategic insights. They care about the big picture - things like ROI, project health (e.g., RAG status: Green for within 5% of budget, Red for exceeding 10%), major risks, and decisions that need their input.
- Technical Teams: Go granular. Include specifics like pull request numbers, technical challenges, dependencies, and discussions around technical debt.
- Support Teams: Focus on user-facing changes. Translate updates into troubleshooting steps and workarounds they can use to help customers.
- Customers: Highlight benefits and new capabilities in simple, engaging language. Keep it brief and to the point.
Avoid jargon when addressing non-technical readers. For example, when explaining a blocker, frame it differently depending on the audience: a technical breakdown for engineers, business implications for executives, and user impact for support teams. This isn’t oversimplifying - it’s respecting your reader’s time and ensuring they can act on the information provided.
| Audience | Primary Focus | Ideal Length |
|---|---|---|
| Executives | Strategic impact, ROI, high-level risks, decisions needed | Under 300 words |
| Technical Teams | Task completion, technical challenges, dependencies | 500–600 words |
| Support Teams | User-facing changes, troubleshooting, workarounds | Moderate detail focusing on user impact |
| Customers | New capabilities and benefits | Under 200 words |
Once you’ve nailed down your audience and adjusted your tone, you can move on to crafting a report format that organizes your insights clearly and efficiently.
Create a Standard Report Format
A consistent report format does more than just streamline internal workflows - it also builds trust and clarity with clients. When your report structure changes frequently, stakeholders waste time hunting for key details instead of focusing on the results. As Deckary points out:
"If your status report structure changes every time, stakeholders cannot scan efficiently. Use a template and stick to it."
By sticking to a standard format, you simplify the process for everyone involved. Executives, for example, can quickly find updates on budgets or blockers, often within a minute. This predictability not only saves time but also helps identify trends and potential issues early, fostering open communication and stronger client relationships.
Here’s how to structure your reports so they’re both clear and actionable.
Main Sections Every Status Report Needs
To ensure your reports are effective, include these essential sections:
- Project Basics: Begin with the project name, manager, and report date for quick identification.
- Project Health: Use a simple color-coded indicator (Green/Yellow/Red) to provide an at-a-glance status update.
- Executive Summary: Write a brief (3–6 sentence) overview covering the project’s current standing, key focus areas, and major challenges. Save this section for last to ensure it reflects the most up-to-date information.
- Progress and Accomplishments: Highlight recent milestones and deliverables completed since the last report.
- Schedule and Timeline: Indicate whether the project is ahead, on track, or falling behind schedule.
- Budget and Resources: Compare actual spending and resource usage against the plan to ensure transparency.
- Risks, Blockers, and Issues: Clearly outline current obstacles. Blockers are immediate roadblocks, while risks point to potential future challenges. As Plane Blog warns:
"A 'on track' status that contradicts the risks section destroys credibility faster than any delay would."
- Next Steps and Action Items: Lay out the next steps with clear responsibilities and deadlines. Consider adding a "Decisions Required" section to flag critical approvals or trade-offs for stakeholders.
This structure ensures your reports are easy to read, helping you maintain transparent and effective communication with your audience.
Use Tables and Charts to Simplify Information
Visual elements can make your reports more digestible by breaking up text and presenting data clearly. The type of visual you choose should match the data you’re sharing:
- Gantt Charts: Perfect for tracking project schedules.
- Pie Charts: Ideal for showing how budgets and resources are allocated.
- Bar Graphs: Useful for comparing values across different categories.
- Stoplight Method: Use Green/Yellow/Red indicators to quickly convey project health.
- Risk Matrices: Map risks by their likelihood and impact, assigning clear ownership for each.
Keep tables simple, with no more than 3–5 columns, to ensure clarity. Avoid using 3D effects on graphs, as these can make data harder to interpret.
| Visual Aid | Purpose |
|---|---|
| Gantt Chart | Track timelines and schedules |
| Pie Chart | Show budget and resource allocation |
| Bar Graph | Compare values across categories |
| Risk Matrix | Prioritize risks by probability and impact |
Maintaining a consistent style across all visuals - using the same fonts, colors, and layouts - makes it easier to compare data over time. This consistency also reinforces your professional image and builds trust with clients.
Collect and Present Project Data
Having accurate and centralized data is the backbone of any credible project report. The best way to achieve this is by using a project management tool as your single source of truth. This eliminates the hassle of manual data collection and ensures that everyone is working with consistent, up-to-date information.
Many project management platforms can automatically populate report templates with real-time data - like task completion rates, budget usage, and flow metrics. This feature saves hours of manual effort. Additionally, setting up recurring update reminders can help avoid those last-minute scrambles. With this system in place, crucial details are far less likely to slip through the cracks.
It’s equally important to validate your data with your team. Those directly involved in the work are often the first to notice inconsistencies that could compromise your report’s accuracy. On average, knowledge workers send 25 messages a day just searching for information and context. Centralizing project data reduces this noise, making everyone's work more streamlined and efficient. By pulling data directly from trusted systems, you ensure your reports are both accurate and easy to produce.
Gather Data from Trusted Sources
When collecting data for your report, rely on trusted sources like your project management platform, financial records, and team updates. Compare your current progress with the original plan - milestone dates, scope, and capacity - to highlight and explain any deviations. This comparison between planned and actual outcomes helps stakeholders get a clear picture of the project’s status.
Consider using a RAG (Red, Amber, Green) system to give stakeholders a quick visual summary of project health: Green indicates everything is on track, Amber signals potential risks, and Red flags issues that need immediate attention. For Agile or technical projects, monitoring flow metrics like cycle time and throughput can help identify bottlenecks before they escalate. Instead of holding endless status meetings, share digital reports that keep everyone informed while reducing meeting fatigue. With reliable data in hand, you can shift your focus to the metrics and milestones that matter most.
Focus on Key Metrics and Milestones
To keep your reports actionable and easy to follow, focus on the most critical metrics and milestones. Start with schedule and milestone metrics, such as planned versus actual completion dates, on-time delivery rates, and the specific deliverables achieved during the reporting period. Financial metrics are equally important - track budget usage (actual versus planned), labor costs, and the percentage of available hours spent on revenue-generating tasks.
Rajni Rethesh from Middleware HQ puts it best:
"A truly effective status report in 2025 isn't about detailing every single task. It's about providing a clear, honest, and forward-looking snapshot of project health that enables informed decision-making."
Rather than listing every task completed, emphasize the impact of those tasks. For example, instead of saying, "API integration completed", explain the result: "Completed API integration, enabling single sign-on." This approach tells a more compelling story. Keep in mind that while only 5% of people remember statistics from a presentation, 63% recall stories. Use the "4 N’s" framework to add depth to your reports: Numbers (time and money), Narrative (the story behind the data), Names (team expertise), and Nuance (external challenges or scope changes).
Write Each Section Clearly and Concisely
Delivering clear and concise status reports does more than just inform - it builds trust by providing stakeholders with a transparent view of the project’s progress. Once you’ve gathered all your data, the key is to present it in a way that’s easy to understand. Each section of your report has its own purpose, and it’s always better to focus on clarity rather than overloading with details. Stakeholders should be able to grasp the project’s status without getting bogged down in unnecessary information.
Executive Summary
Write a brief, 2–3 sentence executive summary that provides a quick snapshot of the project’s health using the RAG (Red, Amber, Green) system. Include a recent development or a pressing issue to give readers immediate insight. It’s best to write this section last, once the rest of the report is complete, so it accurately reflects the overall picture.
As Sneha Kanojia explains:
"The executive summary is a three to five-sentence snapshot of the most important things a reader needs to know." – Sneha Kanojia
Focus on outcomes and their impact rather than just listing tasks. For example, instead of saying "Completed database migration", try "Migrated database to new infrastructure, reducing page load times by 40%." Also, avoid hiding important decision requests within lengthy updates.
Once you’ve outlined the project’s high-level status, back it up with specific progress and achievements.
Progress and Completed Work
This section should outline what’s been accomplished or changed since the last report. Instead of listing every technical detail, frame updates around outcomes. For instance, replace "Worked on API" with "Completed API integration for user authentication, enabling single sign-on", to better highlight the impact of the work.
Use comparisons to provide context. Saying "Completed 15 of 20 planned features for this sprint" gives a clearer picture than simply stating "Completed 15 features." Visual aids like progress bars or Gantt charts can also help simplify complex information. While raw numbers are helpful, pairing them with a compelling narrative makes the progress more memorable.
Timeline and Budget Updates
Provide an update on any changes to the schedule or budget to maintain transparency. Include original and revised dates, explain the reasons for delays, and compare actual spending to planned budgets. For example, instead of saying "slightly delayed", specify that the user testing phase was extended from April 10 to April 17, 2026, due to additional QA cycles required by unexpected bug reports.
If $42,000 was spent against a $40,000 budget, mention the overage and provide a brief explanation. This level of detail minimizes surprises and shows proactive management. For freelancers, syncing budget details with tools like Paid on Time can ensure payment schedules align with these updates, reinforcing reliability.
Risks, Problems, and Next Steps
Clearly separate potential risks from current issues, and outline actionable plans for each. For every item, include a description, its potential or actual impact, an assessment of likelihood (for risks), and steps to address it.
Pair every identified problem with a specific solution. When listing next steps, assign clear accountability by naming an owner and setting a firm deadline. For example, rather than saying "Review design mockups", specify "Sarah Chen to review and approve final design mockups by April 15, 2026." This level of precision ensures tasks are tracked and resolved efficiently.
Review and Finalize Your Report
A well-prepared report not only informs but also builds trust. It shows professionalism and ensures stakeholders feel confident in the project's progress. Before sending it out, double-check every detail to ensure accuracy and clarity. Even small mistakes can hurt credibility, while a carefully reviewed report reassures everyone that the project is on track.
Check for Errors and Accuracy
The final review is your chance to tie up loose ends. Work with team members directly involved in the project to confirm that milestone updates, timeline projections, and mitigation plans are based on actual data, not assumptions. This step helps catch any inconsistencies before the report reaches stakeholders, ensuring everyone is aligned on the project's status.
Be especially mindful of consistency across sections. For instance, marking a status as "On Track" while listing unresolved major risks elsewhere can quickly erode trust. Ensure all risks have clear owners, and include concise explanations for every metric - don’t just present the numbers without context.
Double-check all dates, budget figures, percentages, and the executive summary to ensure they align with the rest of the report. Test any links to supporting documents, like project roadmaps or RAID logs, to confirm they work. Simplify the language by removing jargon and unnecessary words, keeping the report brief - ideally under two pages. This thorough review sets the stage for integrating stakeholder feedback.
Gather Feedback and Implement Final Revisions
Once you've completed the internal review, seek input from stakeholders to fine-tune the report. Ask them if the format is easy to follow and whether any details need further clarification. For more complex updates, consider discussing the report in real-time, as live conversations often provide better insight than written comments.
Use the feedback to make specific improvements. For example, if a client has trouble locating budget details, reorganize that section to make it more prominent. If decision-makers want quicker access to key points, highlight those sections more clearly. Store the finalized report in a central location to maintain an audit trail of project decisions and health trends over time. This archive can be a valuable resource for identifying patterns and revisiting past commitments when needed.
Conclusion
Your project status report can do more than just update stakeholders - it can serve as a key tool to build trust and drive project success.
Clear reports act as trust-builders, showing stakeholders that the project is under control. By focusing on clarity, consistency, and transparency, you can replace lengthy status meetings with a single, reliable source of information that keeps everyone on the same page.
When reports are clear, stakeholders can quickly understand the project’s status and make informed decisions. A consistent format and regular updates make it easy for clients to find the information they need without extra effort. Transparency - especially when it involves sharing challenges early - proves that you’re managing proactively rather than reacting to problems. As Rajni Rethesh aptly says, "Predictability breeds trust".
Using visual cues like Red, Amber, and Green status codes helps stakeholders quickly assess project health. Honest reporting about risks before they escalate builds respect and keeps projects on track, preventing costly delays or budget overruns. By sticking to a structured format and incorporating data-driven insights, you’re not just sharing updates - you’re building confidence in your ability to deliver.
A well-organized status report reduces unnecessary back-and-forth, allowing everyone to focus on meaningful tasks instead of searching for updates. It also creates a searchable record of decisions and trends, offering valuable insights into the project’s history.
FAQs
What should I include in a status report for executives vs. engineers?
When creating project status reports, it's important to adjust the content based on your audience. For executives, keep things high-level and concise. Focus on providing an overview, highlighting key metrics, outlining major milestones, addressing risks, and listing priorities. This helps them make informed strategic decisions without getting bogged down in details.
On the other hand, reports for engineers should be more detailed. Include updates on specific tasks, technical challenges, roadblocks, and deliverables. This ensures everyone on the team stays aligned and can work together to solve problems effectively.
The key difference? Executive reports are all about strategy and clarity, while engineer reports dive into the operational nitty-gritty.
How do I choose Green/Yellow/Red when risks exist?
When assessing project risks, assign a color code to represent severity and likelihood:
- Green: Indicates low risk or issues that are under control and not likely to escalate.
- Yellow: Represents moderate risks that require monitoring or mitigation to prevent escalation.
- Red: Signals high risks or critical threats demanding immediate attention and action.
It's important to regularly review and update these risk statuses to keep everyone informed and ensure timely, proactive management.
What key metrics should I track without listing every task?
When crafting a project report, emphasize high-level metrics such as project health, milestone progress, risks, and upcoming work. These areas give stakeholders a clear snapshot of the project’s overall status. By focusing on these critical aspects, you help decision-makers quickly grasp progress, identify potential challenges, and take action where needed.
Avoid delving into individual tasks, as this can clutter the report and dilute its impact. Keeping the content concise and focused ensures the report remains both informative and easy to digest.